

Profit is not cash. Follow one order through a hypothetical wholesaler to see how the cash conversion cycle sets the pace of growth, and which kind of capital fits the gap.
A distributor has its best quarter ever. Orders are up, the sales team is pleased, and the accounts show a healthy profit. Then payroll week arrives and the bank balance cannot cover it. The owner suspects a mistake somewhere. Usually there isn't one. The income statement and the bank account are answering different questions.
The income statement records a sale when the goods are delivered, whether or not anyone has paid. The bank account records only movement. In a business that buys stock, holds it and sells on credit, those two clocks can run months apart, and growth stretches the distance between them. That gap sets how fast a company can grow on its own money, and it decides which kind of capital suits the problem.
One order, followed through
Take a hypothetical wholesaler of kitchen appliances; these are the assumptions for the rest of the article. Annual revenue is $6 million. Cost of goods sold is 75% of revenue, or $4.5 million. Operating costs such as wages, rent and fuel run at 15% of revenue and are paid as they are incurred, so pre-tax profit is 10%, or $600,000. Suppliers give 30 days to pay, stock sits in the warehouse for an average of 90 days before it sells, and customers pay 60 days after delivery. Ignore tax, interest and equipment purchases for now.
Now follow a single $10,000 order. The goods cost $7,500 and arrive on day zero. The wholesaler pays its supplier on day 30, ships to the customer on day 90, and is paid on day 150. Around $1,500 of wages and rent attributable to the order goes out along the way. The order earns $1,000 of profit, and every dollar of it is real. But from day 30 the company is $7,500 out of pocket, closer to $9,000 once operating costs are counted, and none of it returns until day 150. For four months the money sits first in a warehouse and then in a customer's promise to pay. Multiply that by hundreds of orders and the business is permanently lending to its stockroom and its customers.
Three clocks, one cycle
Finance teams compress that story into three numbers. Receivable days measure how long customers take to pay: receivables divided by revenue, times 365. Inventory days measure how long stock sits before it sells, calculated on cost of goods sold because stock is carried at cost. Payable days measure how long the company takes to pay suppliers, also on cost of goods sold. The cash conversion cycle is receivable days plus inventory days minus payable days. For our wholesaler that is 60 + 90 − 30 = 120 days, the same four months the single order took.
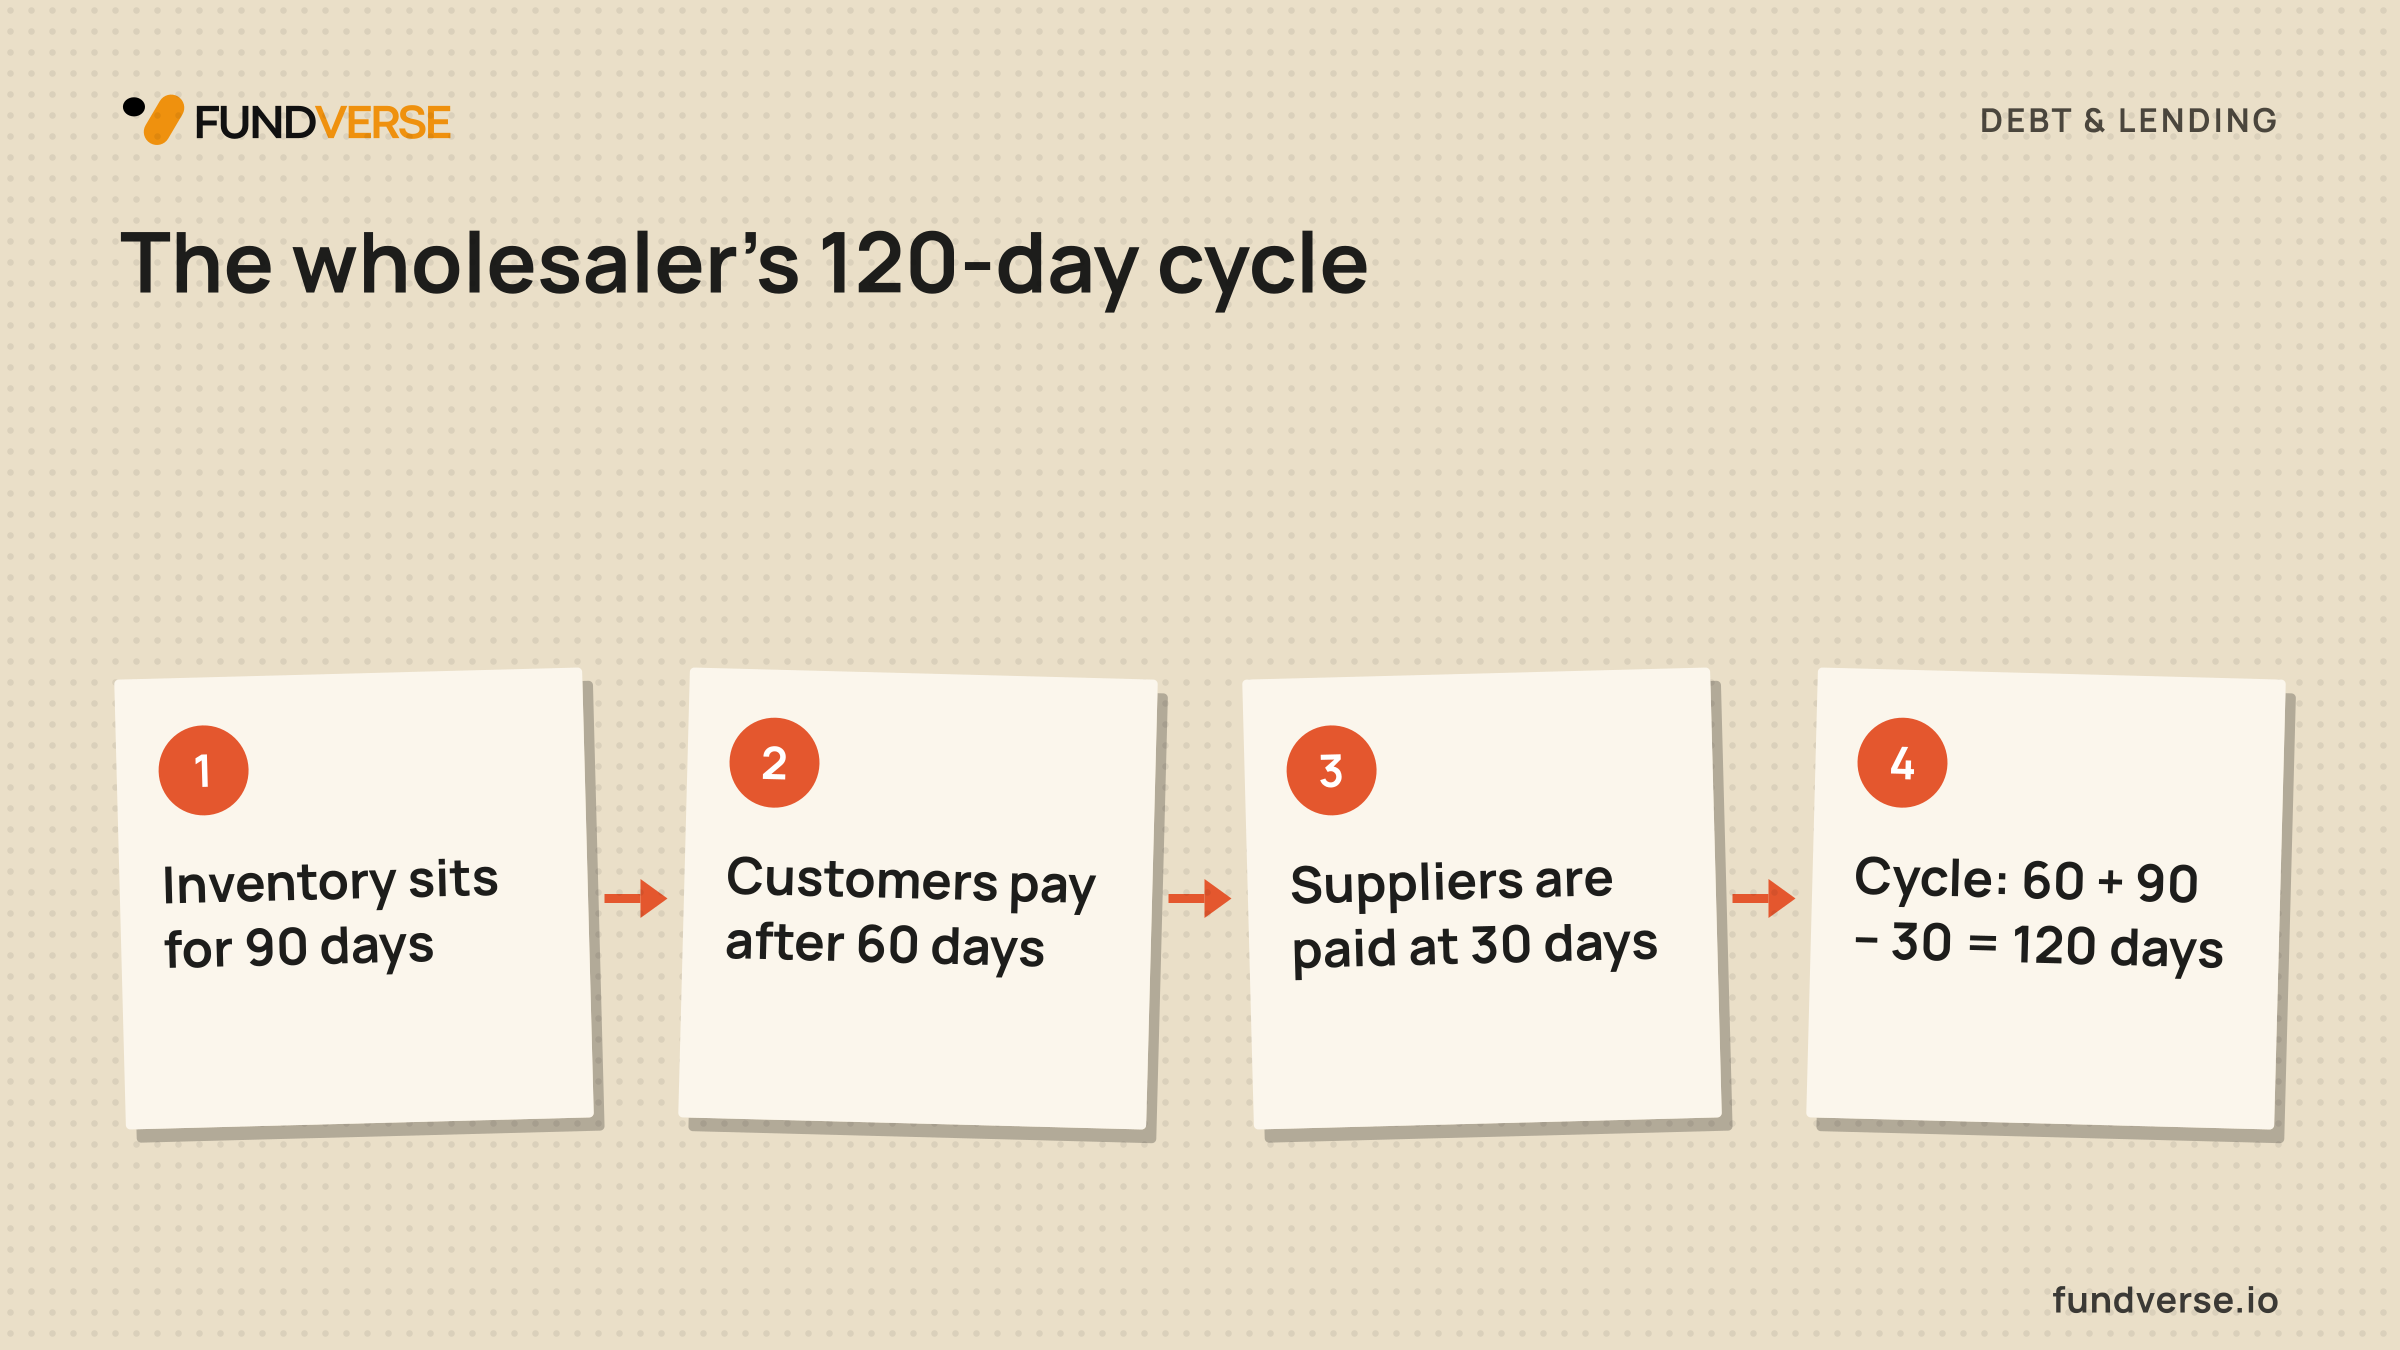
Turning days into dollars is what makes the number bite. Receivables are $6 million × 60/365, about $986,000. Inventory is $4.5 million × 90/365, about $1.11 million. Payables, the supplier credit that funds part of the stock, are $4.5 million × 30/365, about $370,000. Net working capital comes to roughly $1.73 million, or 29 cents for every dollar of annual revenue, against a profit of 10 cents. The business needs nearly three dollars of working capital for every dollar of annual profit.
If anything, the formula flatters. It leaves out wages and rent, which are paid well before the customer pays, so a company with heavy operating costs and a long cycle needs more than the three clocks suggest.
Why faster growth widens the hole
Suppose orders double next year to $12 million, with margins, terms and stock levels unchanged. Profit doubles to $1.2 million. Working capital doubles too, from $1.73 million to about $3.45 million, and that $1.72 million increase has to be paid before the extra sales turn into cash. Set it against the profit and, assuming the first year's working capital is already in place, the company faces a cash shortfall of roughly $0.5 million in the best profit year it has ever had. That is the annual picture. Because stock must be bought ahead of sales, the low point inside the year is deeper.
There is a quick way to estimate the damage in advance. Extra working capital per extra dollar of revenue equals receivable days/365 plus the cost-of-goods ratio times (inventory days minus payable days)/365. Here that is 0.164 + 0.75 × 0.164, or about 0.29. A plan to add $3 million of annual sales needs roughly $860,000 of funding before the first of the new customers pays. The same formula shows where the leverage is: cutting receivable days by 10 on $6 million of revenue frees about $164,000 without a single new customer.
Matching capital to the gap
Not all of that need is the same kind of need. Part of it swings with the season and the shipment calendar, and it repays itself as stock becomes receivables and receivables become cash. Another part is a permanent layer that grows with revenue and comes back only if the business stops growing or is sold. Most mistakes in financing this gap come from using a tool built for the first layer to fund the second.
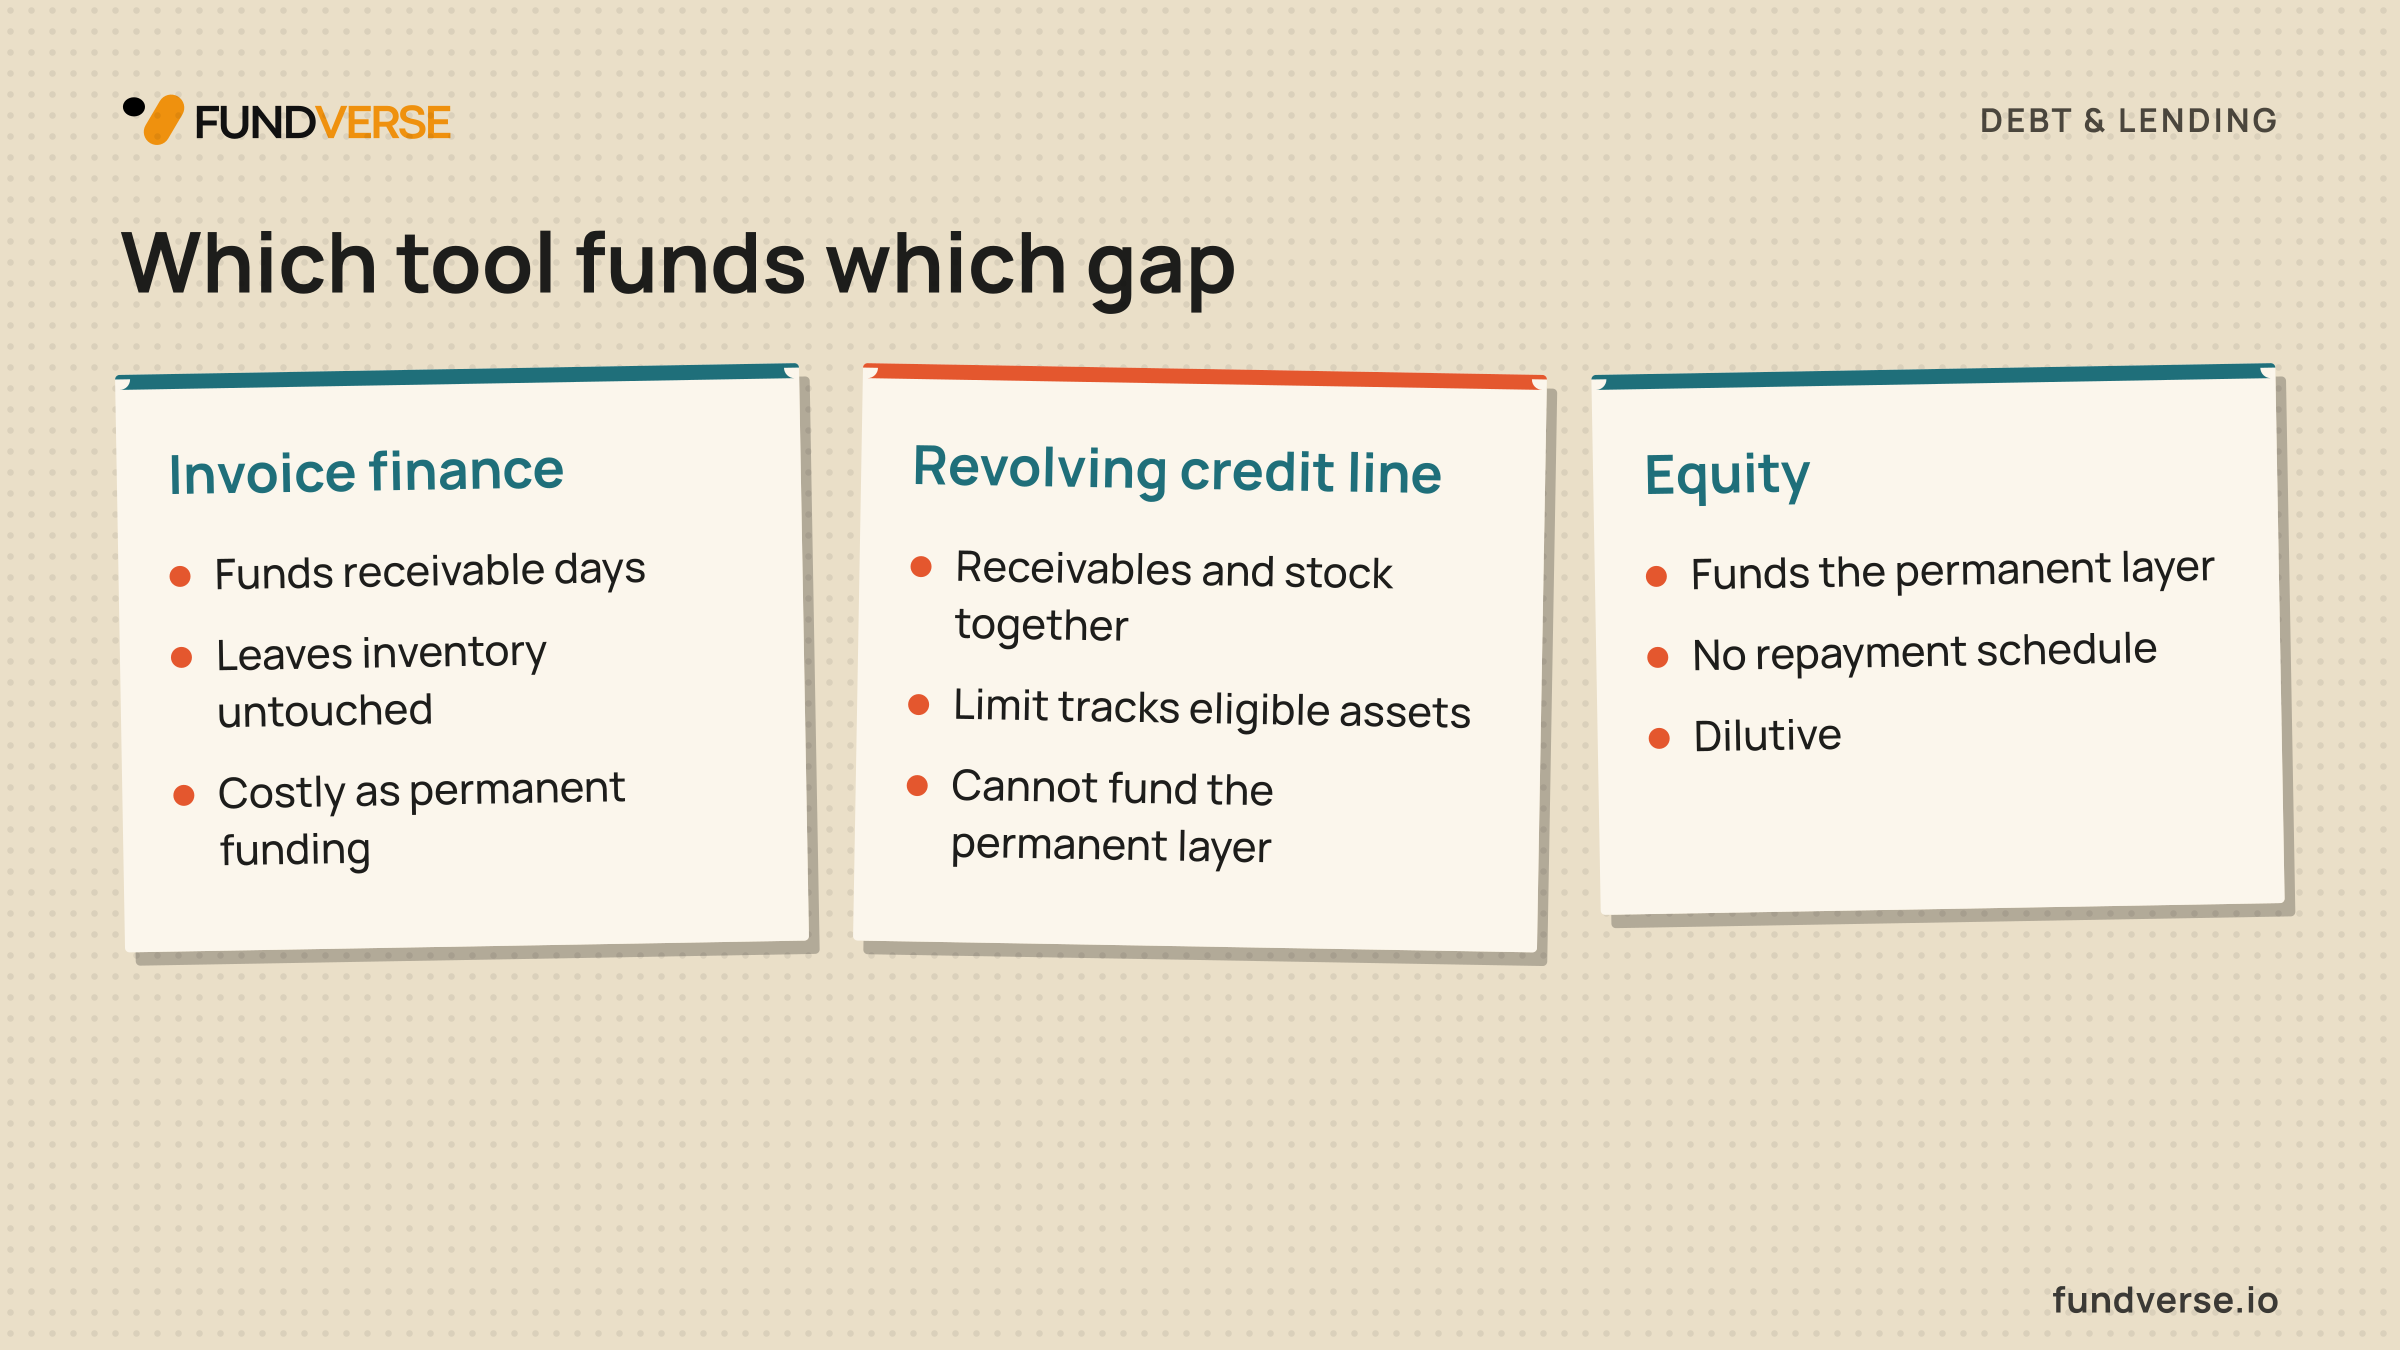
| Option | What it funds | What the funder assesses | Security and conditions | Where it falls short |
|---|---|---|---|---|
| Invoice finance | Receivable days | Customers' credit quality, disputes, concentration | Invoices assigned to the financier, who advances a share now and pays the rest, less fees, on collection | Leaves inventory untouched; costly if used as permanent funding |
| Revolving credit line | Receivables and inventory together | Borrowing base and cash-generation record | Charge over receivables and stock; regular reporting; financial covenants | Limit tracks eligible assets, so it cannot fund the permanent layer |
| Trade finance | Goods in transit and supplier payment terms | The specific trade: buyer, supplier, goods, documents | Control of shipping documents or the goods; letters of credit or guarantees | Suits repeat, well-documented trades; paperwork heavy |
| Equity | The permanent layer and the margin lenders will not advance | Growth prospects, returns, management | No security and no repayment schedule; investor rights instead | Dilutive; a poor use of capital for swings debt could carry |
A working capital lender is rarely focused on profit. It wants to know whether the assets it lends against will turn into cash. For receivables that means who owes the money, how old the invoices are, how concentrated they are in a few customers and how often credit notes and disputes shrink them. For inventory it means whether the stock sells quickly near cost or ages into obsolescence. The lender then advances only a percentage of eligible assets, which is the borrowing base.
Run the wholesaler at $12 million with assumed advance rates of 80% on receivables and 50% on stock. Receivables of about $1.97 million support $1.58 million, and inventory of about $2.22 million supports $1.11 million. Availability is about $2.69 million against a net need of $3.45 million. The remaining $0.76 million or so is the haircut, and it has to come from retained profit or from investors. The haircut is where the lender's protection lives.
Covenants police the arrangement. Typical ones include borrowing base certificates delivered regularly, caps on how much of the book any one customer may represent, minimum liquidity or interest cover, and limits on dividends. Some facilities also require a clean-down, where the balance falls to a low level for a stretch each year, to show the line is funding swings rather than the structural gap. Security usually sits over receivables and stock, often as part of a wider charge on business assets, which is the same logic that makes a bank loan priced on collateral quality rather than on how good the business is. Risk lands differently by product. With recourse invoice finance the business still carries the risk that customers don't pay. Non-recourse arrangements shift some of that to the financier, usually for a higher fee. Equity carries everything, which is why it asks for the most in return.
So invoice finance suits a business whose problem is slow-paying but creditworthy customers, and a revolving line suits wide swings against a clean asset base. Trade finance fits a gap concentrated in importing and shipping. Equity, or long-dated debt, fits the layer that never goes away (the choice between debt and equity is largely this question). A line used to fund permanent growth works until the lender notices the balance never clears, and lenders in that position often tighten limits just when the business needs them most.
If a working capital gap is behind your next raise, Fundverse investor matching can help you reach the right funder, whether that is a lender who works against receivables and stock or an investor who funds the permanent layer.
Spotting cash-hungry growth early
For investors and lenders, the warning signs sit in the statements well before the overdraft appears. Compare growth line by line. Receivables rising faster than revenue means customers are slowing down or sales are being bought with longer terms. Inventory rising faster than cost of goods sold means stock is building ahead of demand or failing to sell. Rising payable days can look like efficiency but may mean the company is leaning on suppliers it cannot afford to pay, so check whether those terms were agreed or simply stretched. Operating cash flow that sits persistently below profit is the clearest summary of all, and a revolving line drawn a little higher at every quarter end, never clearing, is a structure being used for the wrong layer.
Then do the arithmetic. Divide net working capital by revenue to get working capital per dollar, call it w. Take the margin the business actually keeps, m, after tax, interest and owner distributions. Growth that profit can fund by itself is roughly m ÷ (w − m). For our wholesaler that is 10% ÷ (28.8% − 10%), about 53%. Grow slower than that and the business funds itself; grow faster and the shortfall is the outside capital required. The figure is generous, since it treats all pre-tax profit as retained and assumes no equipment spending, so a real company's number will be lower. A plan to double revenue reads like a profit story, but in this arithmetic it is a financing requirement of about half a million dollars, plus a buffer.
So before a term sheet is signed or a credit approved, ask for the growth plan as a working capital schedule: planned growth, the three day-counts, and the month in which cash is expected to be lowest. If the plan runs above the self-funded rate, size the outside money to the gap. Put the swinging part on a line secured against receivables and stock, and put the permanent part on capital that does not have to be repaid on a timetable the cash cycle cannot meet.
Frequently asked questions
Topics
cash conversion cycle
working capital
growth and cash flow
invoice finance
revolving credit facility
trade finance
borrowing base
working capital financing
Raising or investing?
Find the right people on the other side of the table, and run the round in one place.