
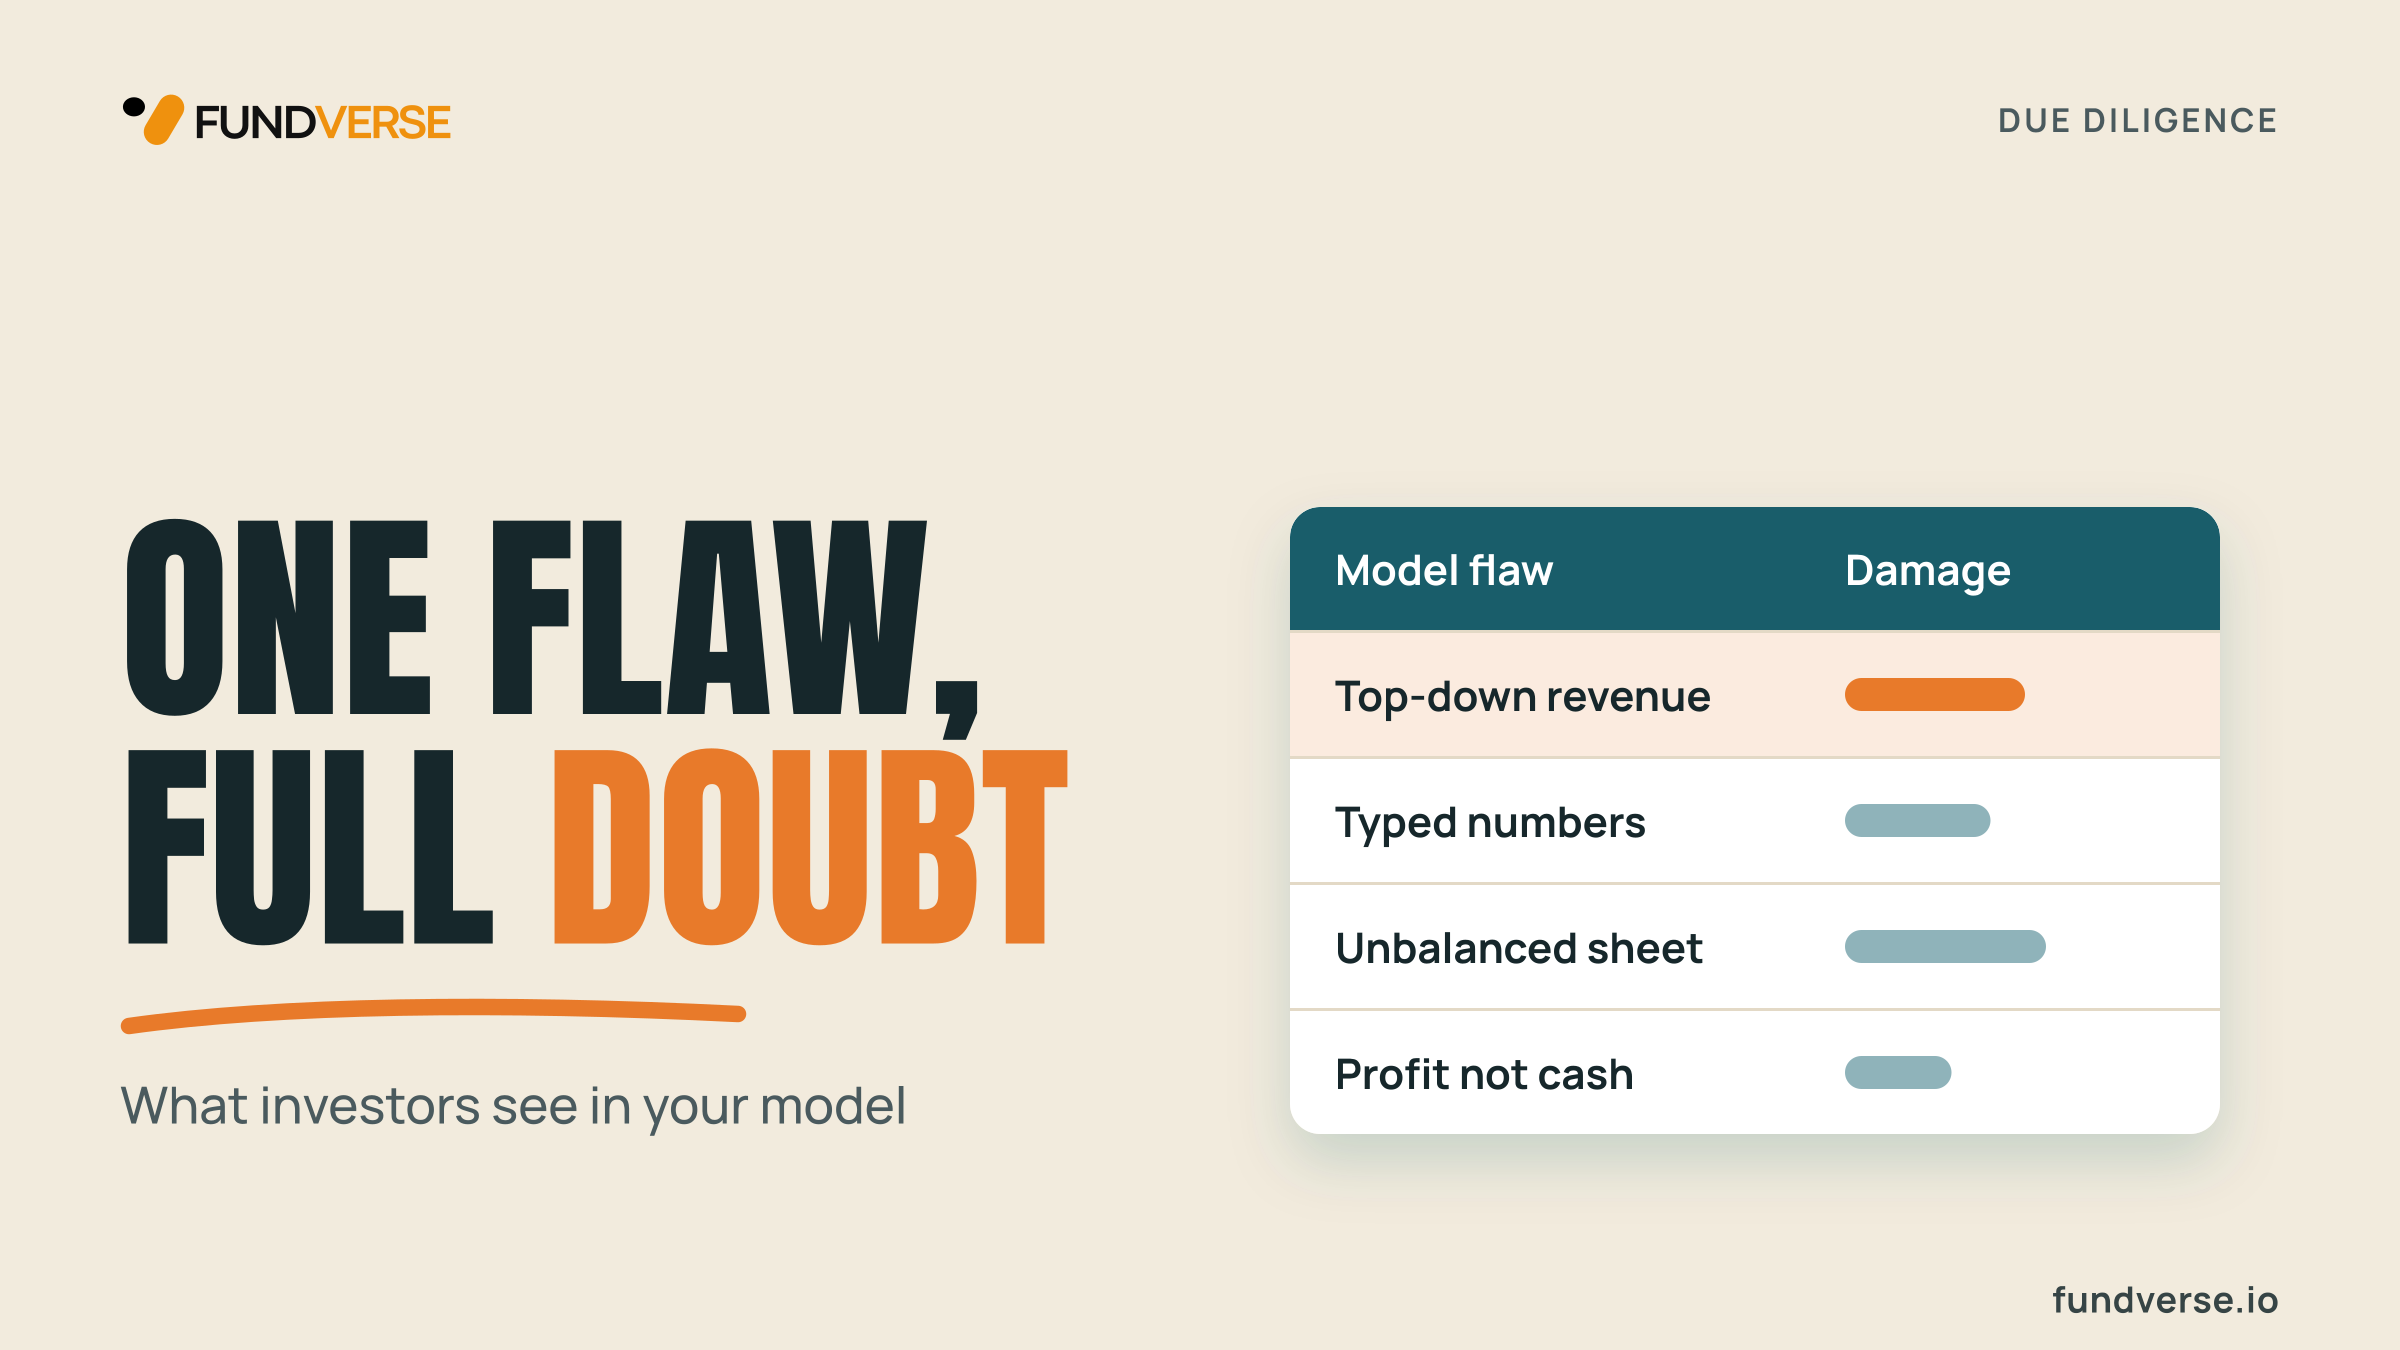

Investors rarely read a financial model as a prediction. They read it as evidence of how a founder thinks, and a few structural flaws can cast doubt on everything else in the pitch.
Every row of a financial model is a decision someone had to make. To fill the first line of revenue, the author has to say where customers come from, how many of them convert, what they pay and how long they stay. To fill the cost lines, the author has to say who is hired, when, at what salary, and what each hire is meant to change. A reader going through those decisions can tell whether they were made by a person who has spoken to buyers, watched a bank balance and managed a team, or by a person filling in a template.
That is why investors, lenders and grant makers rarely read a model as a forecast to be believed. They know the later columns will be wrong, as every forecast for a young or changing business is. A cautious number is forgivable and an optimistic one is expected. What damages credibility is a structural flaw, because it says something about how the business is understood: revenue with no connection to what drives it, costs booked without regard to when cash leaves, a balance sheet that does not balance. The doubt does not stay in the spreadsheet. It travels to the market size on slide four and to the pipeline described on the call. What follows covers the flaws that do the most damage, why each one does, and how to find them before anyone else does.
What investors are really reading
Nobody can verify year-three revenue at the time of an investment, but anyone can judge the reasoning behind it. The model is also the one place where a founder's claims are forced to agree with each other. A pitch can call the business capital-efficient while the hiring tab adds thirty people before the first sale, and the two statements only collide when someone reads both. Reviewers look for exactly those collisions, which is part of why a polished deck and a loose model fit so badly together, as the gap between a deck and its numbers shows.
Once one structural flaw appears, the reader's question changes from "is this plausible?" to "what else is not connected?" If the hiring plan does not respond to revenue, perhaps the marketing budget does not either. Diligence widens, document requests multiply, and claims that would have been accepted are now checked. The cost is not only a lower valuation. It is slower progress and fewer concessions on terms, because a reader who doubts the author's grip on the business wants more protection.
Revenue built from the top down
The most common structural flaw sits in the first row. Top-down revenue starts with the size of a market and applies a share of it. If the market is $2 billion and the business wins 1%, revenue is $20 million. The arithmetic is simple, which is its appeal, and the percentage is chosen to sound modest, since one percent of a very large number feels like an easy claim.
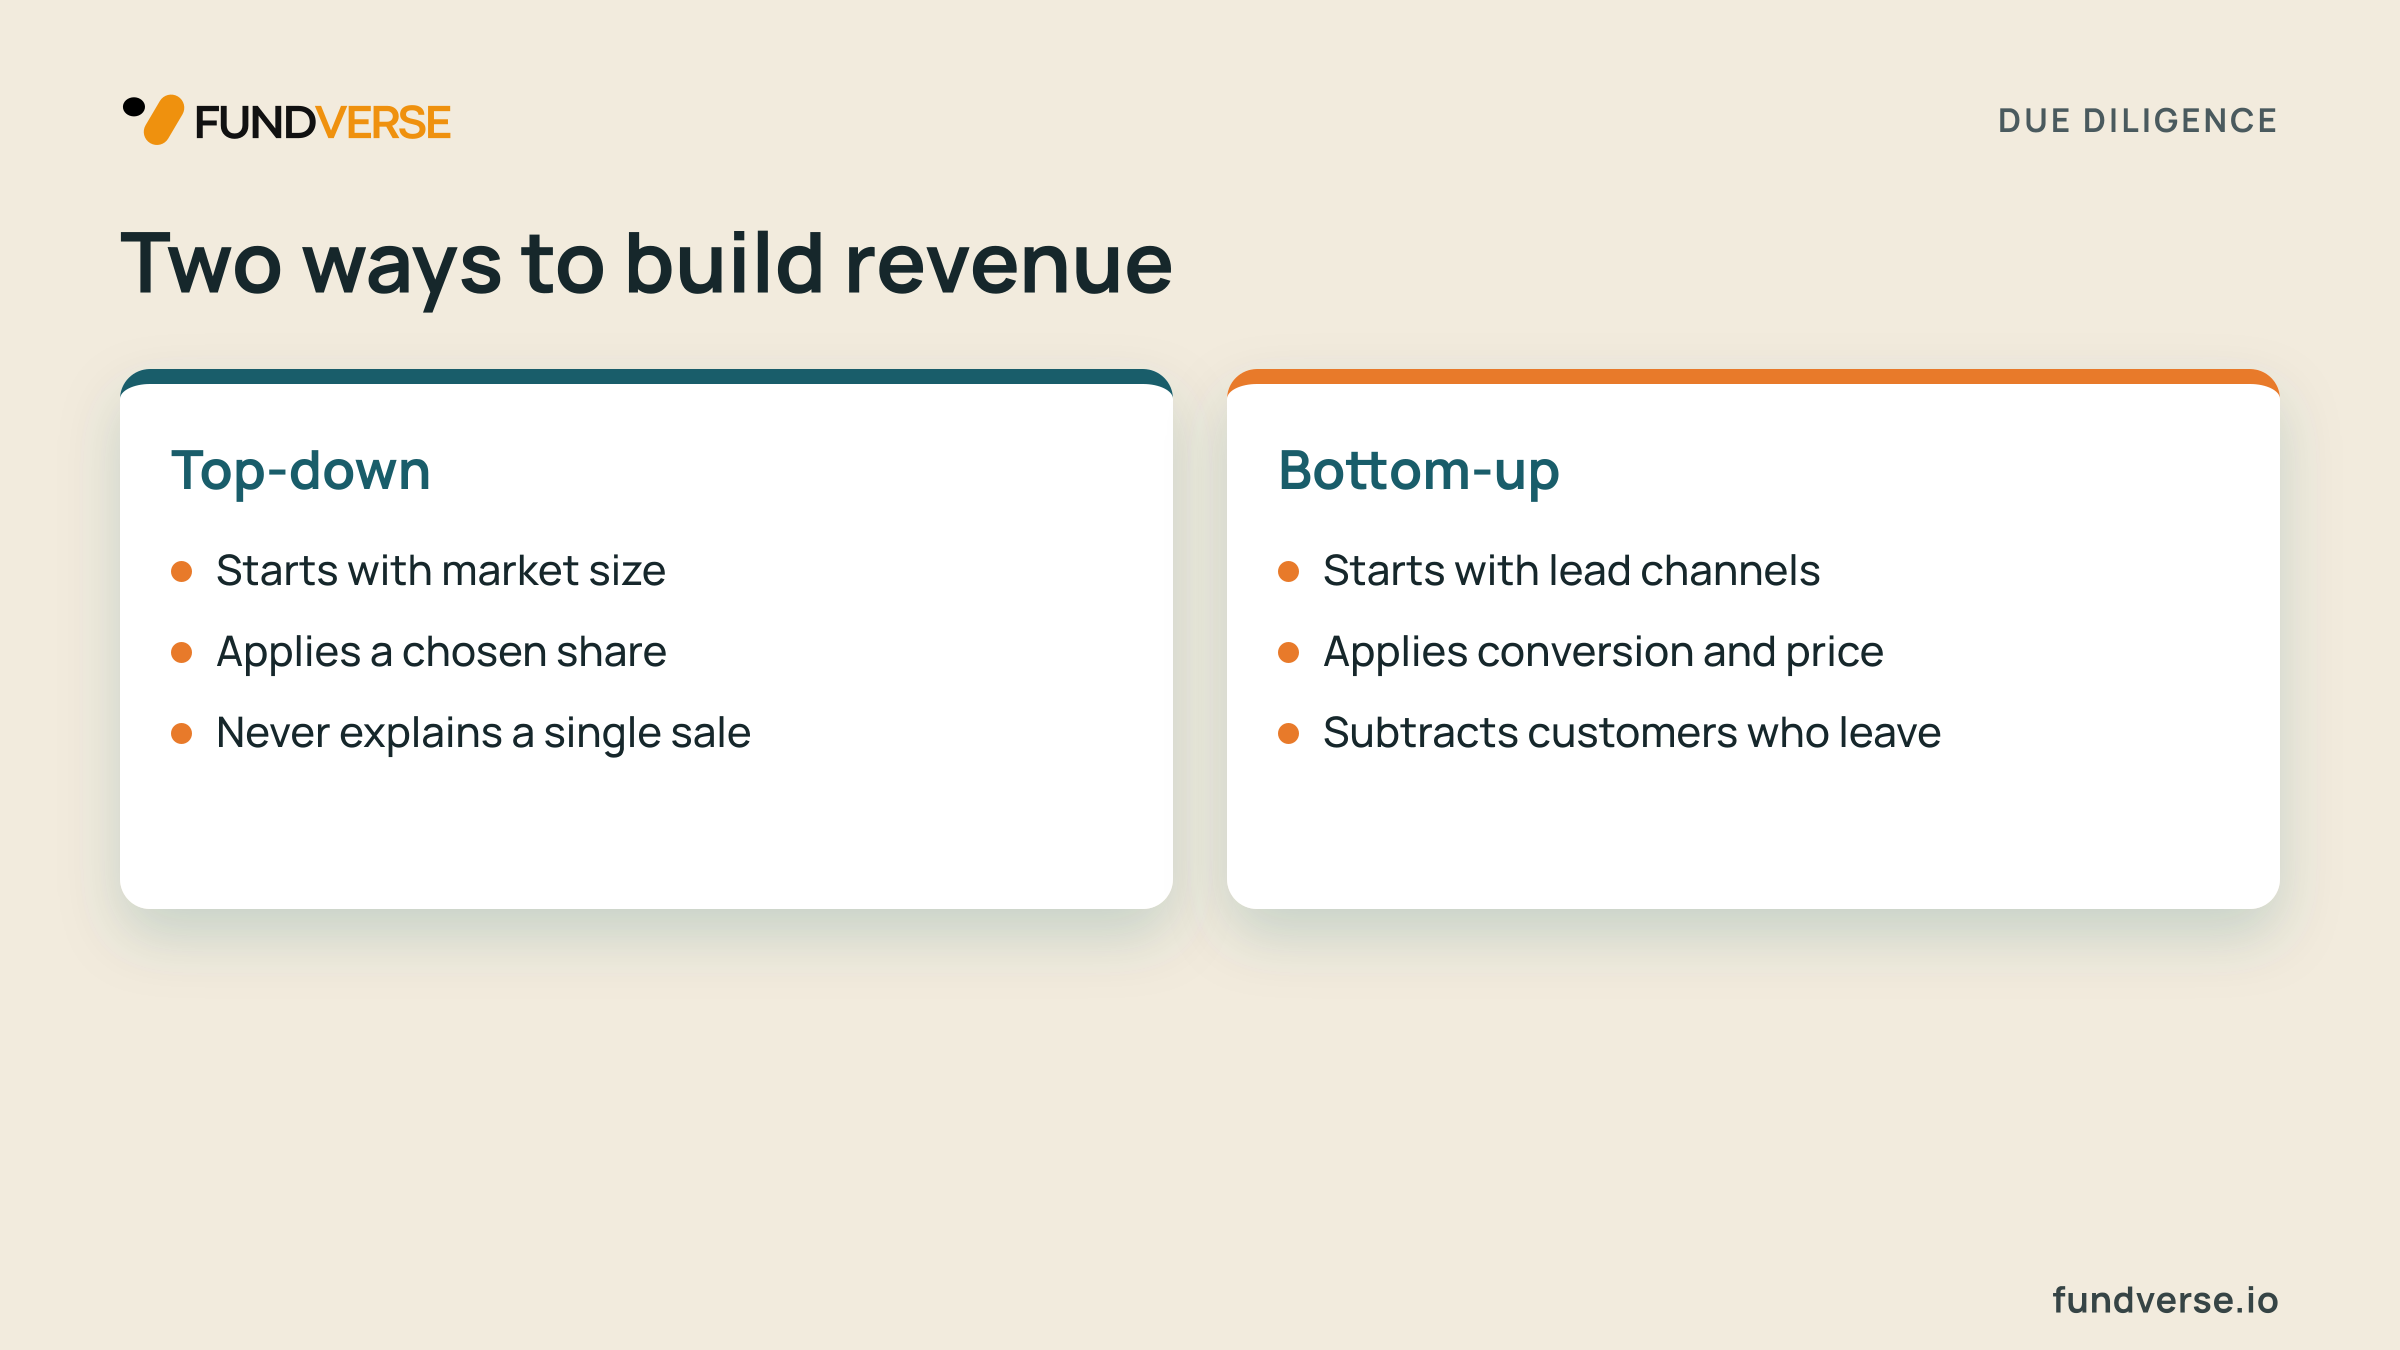
It fails scrutiny because nothing in it explains how a single customer is won. The 1% is an outcome presented as an input, and any other percentage could have been typed with equal justification. A reader will convert it back into something concrete: if the average customer pays $10,000 a year, $20 million means 2,000 customers. How many sales conversations does that take, with how many salespeople, over what period, at what cost per customer won? The model should already have answered those questions. When it has not, the reader concludes that market size was used to decorate the forecast, not to derive it.
Rebuilding it from customers
Bottom-up revenue runs the other way. It starts with the channels that produce leads, applies a conversion rate to get customers, multiplies by price, and then subtracts the customers who leave. Take an illustration with assumptions chosen only to show the mechanics, not as benchmarks for any sector: 200 qualified leads a month, 5% converting, a price of $400 a month, and 3% of customers lost each month. That produces 10 new customers a month. Because some leave, the customer base does not grow in a straight line. After twelve months it is roughly 96 customers, so monthly revenue is about $38,000.
Now change one input. If conversion is 3% instead of 5%, new customers fall to 6 a month and the twelve-month base to about 58, which is monthly revenue near $23,000, roughly 40% lower. A modest change in a single assumption moves the whole outcome, and that sensitivity is what an investor wants to see, because it shows which assumptions deserve evidence. Each driver can be tested against something real: conversations, pilots, past months, supplier quotes. Market size still has a place, as a ceiling that tells you whether the customer counts you arrive at are believable. It checks the forecast but does not produce it.
Mechanical errors that read as carelessness
Errors of judgment take a conversation to expose. Mechanical errors take a few minutes, and reviewers go looking for them early because they are cheap to find. They matter beyond the arithmetic, since a person who does not control the spreadsheet is unlikely to control the operating detail it describes.
Typed numbers and broken links
A hard-coded number is a figure typed over a formula, or a total typed in where a sum belongs. It looks identical to its neighbors until someone changes an assumption and one cell refuses to move. When a reviewer raises the growth rate to test it and a downstream total stays still, the moment is among the most damaging in a diligence call. It suggests the model was adjusted late to reach a target, and that its outputs cannot be trusted to respond to its inputs.
Statements that do not reconcile
A full model has three linked statements. The income statement shows profit, the cash flow statement shows how cash actually moved, and the balance sheet shows what the business owns and owes at a date. They have to agree: profit feeds the balance sheet through retained earnings, closing cash on the cash flow statement must equal cash on the balance sheet, and assets must equal liabilities plus equity. When they do not, something has leaked. A loan has been counted as revenue, depreciation has not been added back, or an expense appears in one statement but not another.
Early-stage businesses are not always expected to present three statements, and a clear monthly cash forecast can be enough at seed stage. But a model that presents all three must tie them together, and the simplest protection is a check row that shows zero when the balance sheet balances. A balance sheet that is out by even a small amount tells the reader the model was never checked by anyone, including its author.
Assumptions that disagree with themselves
The third kind is quieter. The price on the summary tab differs from the price driving revenue. The headcount in the hiring plan does not match the one feeding payroll. The growth rate in the deck is not the rate in the model. Currency, tax and inflation assumptions are applied in one tab and ignored in another. Usually an assumption lives in several places and was updated in only some of them, so the fix is structural: every assumption lives in exactly one cell and everything else points to it.
Profit that never becomes cash
The flaw most likely to sink a real business, not just a pitch, is treating profit as if it were cash. The income statement records revenue when it is earned and costs when they are incurred. The bank account records money when it moves. A plan can show a healthy profit in every month and still run out of money, because the two timelines do not line up.
A simple illustration shows how. A business sells $70,000 of goods to commercial customers on 60-day payment terms. It paid $40,000 for the inventory and $20,000 in payroll that month. The income statement shows a $10,000 profit. The bank account is $60,000 lower, and the $70,000 sits on the balance sheet as a receivable that will not arrive for two months. If the business grows the next month, it buys more inventory and pays more people before the first receivable is collected, so faster growth deepens the cash hole. The profit figure was accurate; the model simply never asked when the money would move. The mechanism is explored further in why a growing business can still run out of cash.
The same gap opens in several places. Receivables delay cash after a sale. Inventory must usually be bought weeks or months before it sells, longer when lead times are long or demand is seasonal. Payroll starts the day a person is hired, while a new salesperson may take months to produce revenue. And debt repayments are the easiest to miss: the principal portion of a loan installment does not appear in the income statement at all, only the interest does. A model can therefore show profit while the business lacks the cash for this month's installment, which is what a lender checks first, using a measure that compares cash available with repayments due.
The remedy is a monthly cash forecast for the first eighteen to twenty-four months, with the timing assumptions made explicit: days to collect from customers, days of inventory held, days taken to pay suppliers, and the dates on which loan payments, taxes and annual contracts fall due. The result will show a lowest cash point. That figure, plus a buffer, is a far better basis for the size of a raise than a round number, and it connects the model to the question of how long the money actually lasts.
Testing the model before sharing it
A stress test asks what happens when the plan meets friction. Change one driver at a time and watch the outputs: lower conversion, a lower price, customers paying thirty days late, a key supplier raising costs, a hire arriving three months before revenue instead of after. Build downside cases from the drivers themselves. Multiplying the revenue line by 0.7 and calling it a downside case teaches nothing, because it does not show which part of the business is fragile. What you want to learn is the point at which the plan fails, and how much warning you would have.
Documentation does the other half of the work. An assumptions sheet should list each driver with its value, the evidence behind it, the date the evidence was gathered and who owns it, separating what has been observed (a signed contract, a past month, a supplier quote) from what is a judgment. Reviewers forgive an honest guess far more readily than a guess presented as fact, and a labeled estimate invites a discussion about how to test it. Evidence that is dated and sourced can be defended line by line, which is the standard described in why assumptions have to be defensible even when valuation is negotiable. Ask someone who did not build the model to try to break it, then keep the final version, and the earlier ones it replaced, in one controlled place such as a data room so that everyone reads the same numbers.
One model, three readers
The same flaw sets off different alarms depending on who is reading. A lender reads the model from the bottom. The questions are how bad things can get while repayments are still met, how much cash cover there is each period, and what collateral or covenants protect the loan if the plan slips. Growth upside matters little to them, so cash timing errors and unrealistic collection assumptions are the most serious.
A venture capital investor reads for the path to a very large outcome. They want to see the drivers of growth, the unit economics (what it costs to win a customer against what that customer returns), and how this round of capital changes the trajectory and reaches the next milestone. A top-down revenue line hurts most here, because it hides exactly what they are trying to understand. A grant maker reads the budget against the activities and outputs promised, checking that costs are eligible, that matching funds are real, that disbursement timing fits when money is needed, and that the work can continue after the grant ends. For them an arithmetic slip in a budget is a question about how the money will be managed. Practice varies by funder and jurisdiction, so check what each one asks for before adapting the model.
If you are preparing a model for investors, lenders or funders, Fundverse's financial analysis tools and data room can help you keep one consistent set of numbers and share it in a controlled way.
Before the next version leaves your hands, pick the one number in the model you would least like to be asked about. Can you trace it to the cell that drives it, to the evidence behind that cell, and to the month in which the cash it implies will actually arrive?
Frequently asked questions
Topics
financial model mistakes
investor due diligence
bottom-up revenue forecast
cash flow forecast
startup financial model
three statement model
stress test assumptions
fundraising financial model
Raising or investing?
Find the right people on the other side of the table, and run the round in one place.